Psychometric Chart/Building Systems

Can someone please answer this question and explain why?

Thank you!
-

Source: A Visual Dictionary of Architecture (2nd ed., p. 122) and Arniko Academy Notes
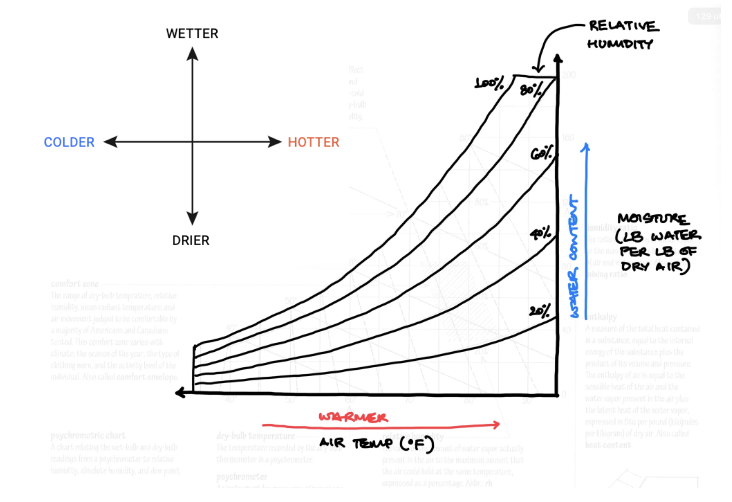
On a psychrometric chart, you pick the “system” based on how the outdoor air needs to move to reach the comfort zone:
-
Humidifier = adds moisture → moves the condition straight up (higher humidity ratio).
-
Dehumidifier = removes moisture → moves the condition straight down (lower humidity ratio).
-
Ceiling fans = don’t change temperature/moisture, but increase air speed, which effectively extends the comfort zone to warmer dry-bulb temperatures (you can tolerate hotter air).
The three plotted climate points relative to the comfort zone:
System A = Humidifier Unit
That point is in the cool/dry region (left/below comfort). The missing piece for comfort is moisture, so humidification is the appropriate strategy.
System B = Dehumidifier Unit
That point is too humid (above the comfort zone). The main fix is remove latent load (moisture), so dehumidification is the appropriate strategy.
System C = Ceiling Fans
That point is too warm but not “fixable” by just adding/removing moisture. Fans help by increasing convective/evaporative heat loss from occupants, effectively shifting acceptable conditions to the right (higher dry-bulb temps).
So the unused options here are Operable Windows and Roof Ponds (those are more situation-specific strategies and don’t match the three plotted points as directly as humidity control + air movement do).

-
-
No problem Sal. There are free customs AI tools for AREs that can help you better understand the concepts like these. Feel free to DM me at rajan@arniko.academy to get access.
Please sign in to leave a comment.
Comments
3 comments