AHPP Backgrounder - Key Financial Performance Indicators (Metrics) p.417

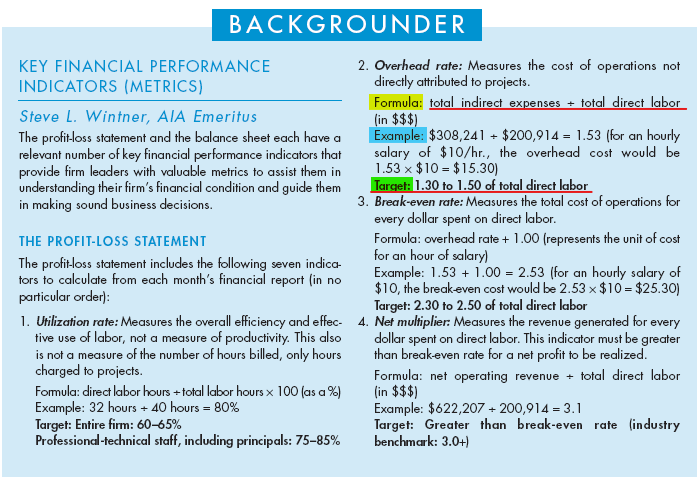
What is the relationship between the example numbers in the Key Financial Performance Indicators (Metrics) Backgrounder on pg. 417 and Table 7.2 Sample Profit Loss Statement in the Mattox Format on pgs. 424-425 & Table 7.3 the Mattox Format Balance Sheet on pg. 427?
It would seem that they should be related, but they aren't. None of the numbers in the examples in the Backgrounder for the profit loss statement match up with any of the numbers in the sample profit loss statement in Table 7.2 (AHPP pgs. 424-425). Are they supposed to? If not, why not?
By contrast, under the balance sheet heading in the Backgrounder, 3. Leverage uses the example $280,738 for total liabilities and $949,451 for total equity. Referring to Table 7.3, the sample balance sheet on pg. 427 I see that line item F. total liabilities = $280,738. This matches the total liabilities in the example from the Backgrounder. However, I can't find any figure resembling the $949,451 for total equity.
The total equity in Table 7.3 is $249,451. Is that an error?
What is going on? Can someone help me sort this out?
-

Citrillion
Key Financial Performance Indicators (Metrics) backgrounder on pg. 417 shows how to calculate those 11 metrics using the P&L (7) and the Balance Sheet (4). In that backgrounder, the narrative first gives the formulas, then applies figures to calculate results, and compares those values to industry benchmarks. Hence, I don't think that the figures/numbers in that backgrounder should match either of the tables at all. If some match, I think that might just be a coincidence. As a result, NCARB expects us to know which P&L and Balance Sheet line items to use to calculate each presented metric, their industry benchmark values, and how to apply them. If I'm not mistaken, all these financial questions on the ARE PcM exam are U/A (Understand & Apply) type.
For example:
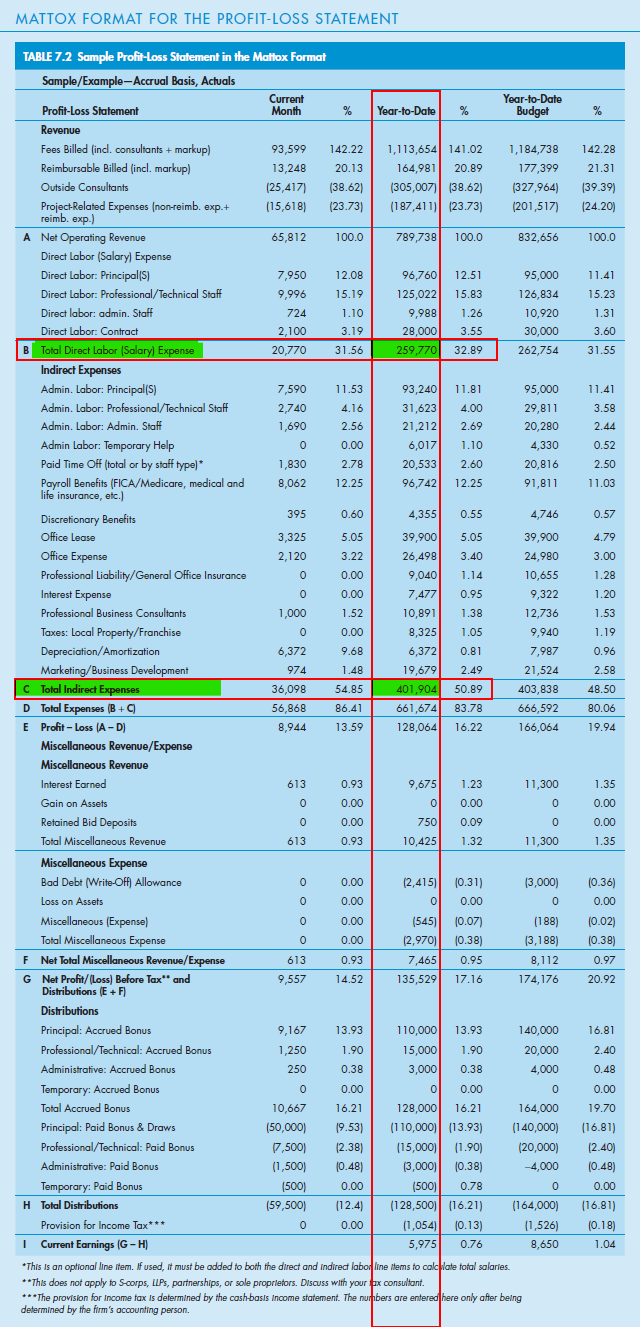
Let's calculate the Overhead Rate of the firm whose P&L statement is given in Table 7.2:
Formula: Total Indirect Expenses (TIE) ÷ Total Direct Labor (TDL)Total Indirect Expenses (TIE): Line Item "C" value from the "Year-to-Date" column >> $401,904
Total Direct Labor (TDL): Line Item "B" value from the "Year-to-Date" column >> $259,770
But we need to deduct the "Direct Labor: Contract" line item's value of $28,000, as it's a project-related expense and should not be included in the firm's OHR calculation. Hence:
Overhead Rate = $401,904 ÷ ($259,770 - $28,000) = 1.734, which seems excessive compared to the industry benchmark. This also signals us to further control (or investigate) our indirect expenses, including the indirect labor. As the value of the OHR is directly correlated with the Total Indirect Expense - which is basically Overhead Expense + Indirect Labor Expense - if either of them increases, the OHR increases, or vice versa. The opposite can be said as well; as the value of the OHR is inversely correlated with the Total Direct Labor - if TDL increases, OHR decreases, or vice versa.
Besides, if you apply the formula with the figures from the "Year-to-Budget" column, you can see that the OHR is inline ($403,838 ÷ ($262,754 - $30,000) = 1.735) with to the planned budget, and "momentarily" for the "Current Month", the OHR is 1.933, which is way over the benchmark limits, which signals to us either the TDL is low or TIE is quite high for the current month. Calculating it as per the "Current Month" is just a snapshot of the firm's OHR; next month's P&L might calculate it as low, but it gives you an idea of where you are momentarily, because the "true/correct/reliable" OHR is calculated via "Year-to-Date", which is practically the moving average of the duration since the beginning of the fiscal year.
Hope this explains it and helps.
Cheers.
-
LeventK
I expected the figures to match. Why use random numbers in the Backgrounder that have no relation to the sample profit & loss statement and the balance sheet? That inconsistency was confusing. Thank you for clarifying that there is no intended connection. Thank you as well for your otherwise detailed explanation.
-
Citrillion,
They don't have to, actually. The backgrounder on pg. 417 is at the end of Chapter 7.2, Financial Management Overview, which wraps up and provides more detail on the concepts discussed in 7.2. On the other hand, P&L and Balance Sheet sample tables are in Chapter 7.3, Financial Management Systems. I don't see any inconsistency here because the figures aren't important. What matters is the key financial terms, which financial instruments to look for, and where to find them.
Cheers.
Please sign in to leave a comment.
Comments
3 comments