Why does a shear diagram flip across the axis?
In the case of the typical uniformally loaded beam the shear is drawn as two triangles of equal size on above and one below the line. why is the left side + and the right side - ?
no one has ever explained this to me, ever, no matter how many times I ask. If shear drops goes from maximum at the end to 0 at the center, the graph should be two triangles like a gian M shape meeting in the center. why? because the counter-force is pushing up at ends where the beam sits on support and trends to 0 at the center where the downward force is more.
but it doesn't, it flips across the line and nobody knows why
-

Hi Robert,
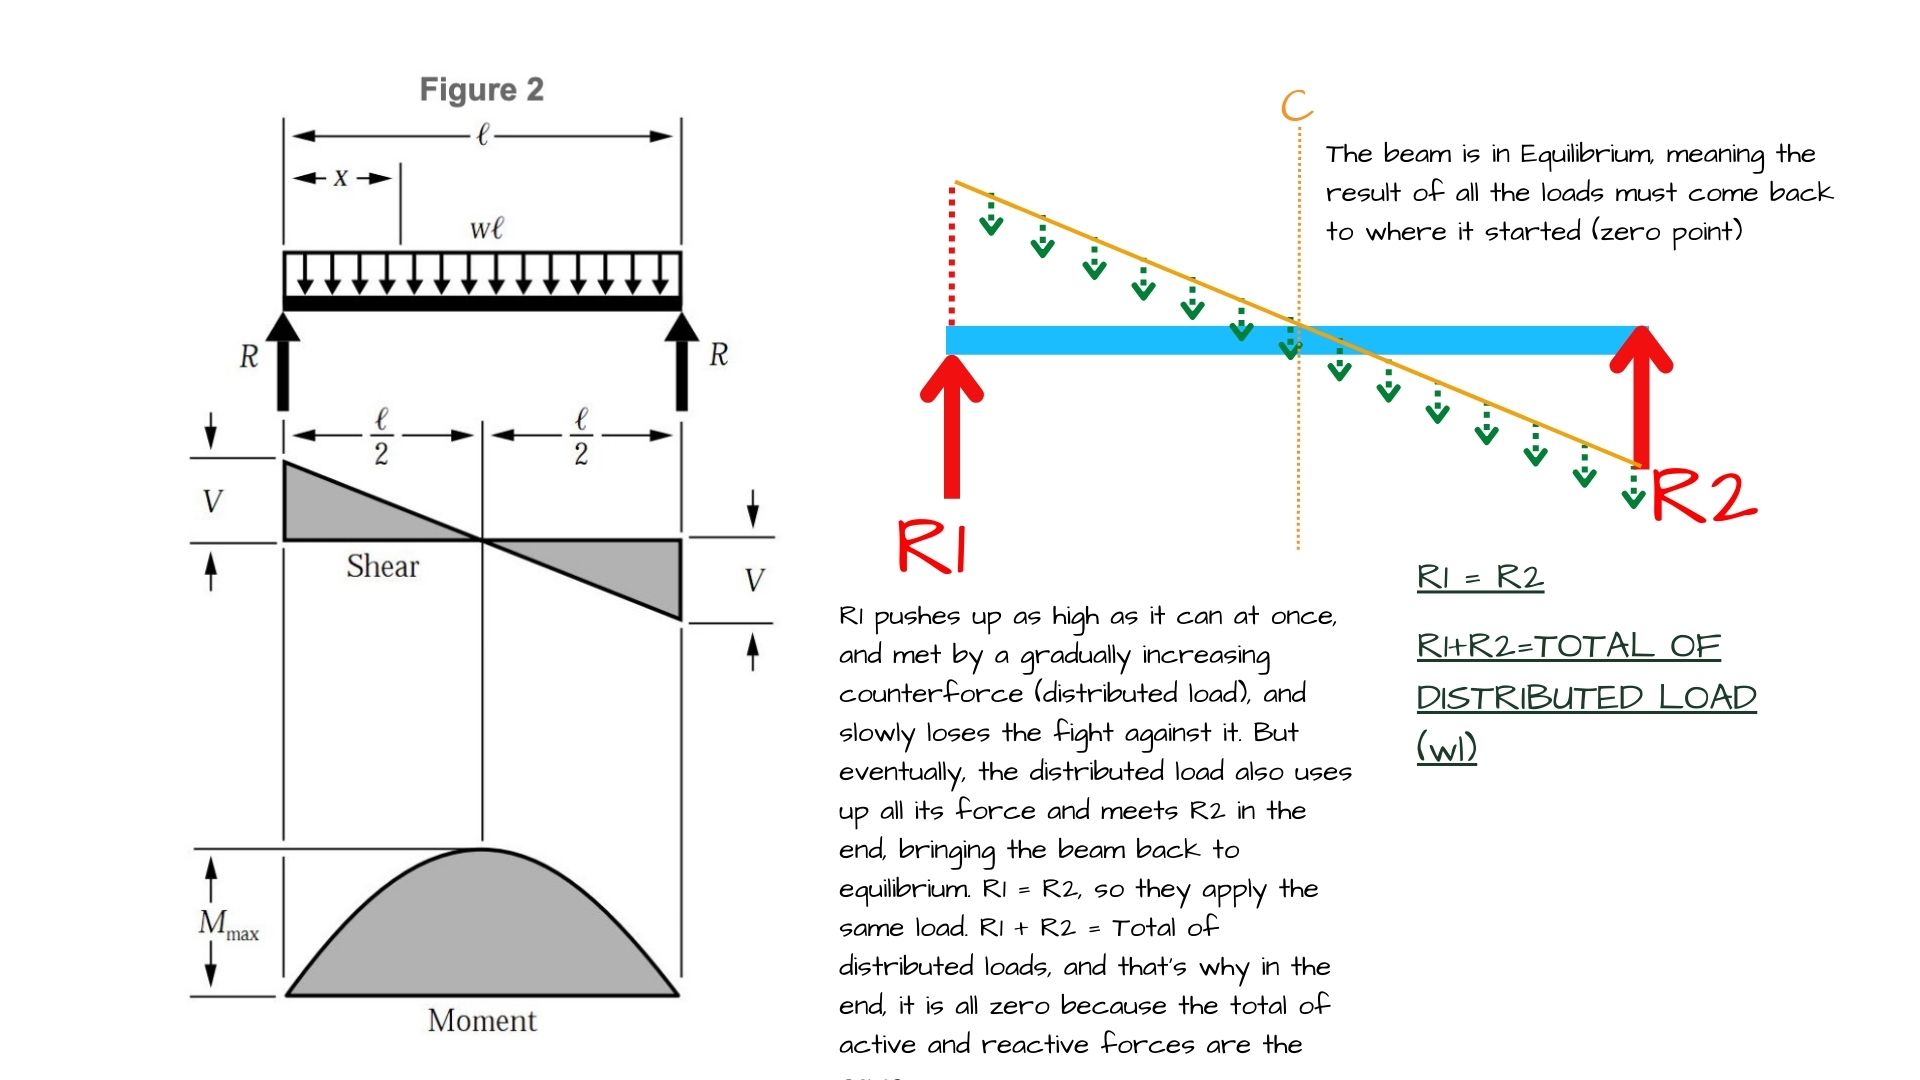
I am not sure if this is the beam you are talking about but based on what I understand, I created a diagram to explain why. On a typical beam with two equal supporting forces on either end, like R1 and R2 below (I called them 1 and 2 to explain things better, but in reality, they are equal, and both are R), if the beam is in equilibrium that means that the total of distributed loads is equal to R1+R2.
I understand that it is customary to start from the left and move to the right on diagrams in structural sciences. That is why the Shear diagram starts from the left and moves to the right.
As you can see in my diagram, the R1 first pushes this beam up with all its force because it is a point load. Points loads apply at once. This instant push is represented with a vertical line on the diagram (red dotted line on my sketch below). On the other hand, distributed loads apply on beams gradually. They are uniformly distributed, meaning the load is divided equally for every inch of this beam and gradually increases. Once the uniformly distributed load reacts to where R1 pushed up this beam, it gradually applies its own force as a reaction to R1. That diagonal line on the shear diagram (solid yellow line on my sketch) represents this gradual application of loads. At the center, the distributed loads must go below the Zero line (thick, blue solid line) because the total distributed loads are twice R1.
Let's explain this with numbers: If R1 is 1 unit, R2 is 1 unit (they are identical, as I said), and their total is equal to the total of distributed loads (TDL), this would make TDL 2 units. Since TDL is 2 units, they will keep pushing this beam further down another 1 unit because they have it in their power. When R1 pushed this beam with all its force, it was all 1 unit. The counter-reaction was 2 units. 1-2= -1, which is below zero 1 unit.
This is why the graphic also shows a gradual decline to below zero as deep as R2 because that -1 unit gradual decline will be met with the +1 unit force applied by R2 in the end. And this will bring the total of all loads back to zero point, and the beam will be in equilibrium.
I hope this was your question and I was able to answer it.
* The note under the sketch below is cut short. It ends with the words: "...forces are the same"
-
But how come the force that is pushing down as twice as R1, would stop in the middle of the beam and starts increasing so the diagram can do the M shape..? For an upward diagonal line on the shear diagram to exist (to create the right wing of the M) you would need an upward pushing uniformly distributed load. The uniformly distributed loads are all pushing down on this beam so the shear diagram continuously has to go down until it meets another upward force at the end of the beam. What you say disregards the action and reaction directions of the loads. R2 is pushing this beam up to bring it to the 0/ equilibrium level. If you think carefully, on an M shaped shear force diagram, R2 should be pushing down which is not the case on this beam. You work your way from one side of the diagram and walk to the other end. Even though R2 is represented at the below zero line on the diagram it is a positive force. It is not the mirror image but R2 is doing the same work as R1, pushes this beam 1 unit upward. Mathematically speaking to bring -1 to 0, you need +1. Another -1 would take it to -2.
-

This is what I keep trying to find, what does the graphic representation mean? It is counter-intuitive to my understanding of physics. Two vectors of force push a section of material in opposite directions at once. Why would they care if they are on the lefthand or righthand side? the forces on each side are equal, thus their behavior should be exactly identical. but its not. and I can't figure out why
-

The diagram you are referring to here is a shear map for a uniformly distributed load (it only represents this kind of condition). This means that the line is representing a load of some weight that is applying an equal force for every foot that you travel across the beam. If the load in question was 15 pounds per linear foot then the slope of that line would be -15 pounds for every foot of beam represented, and the the line is continuous from start to finish, because the load never changes.
Conceptually this also works, because you need to show an equal amount of positive and negative shear and moment in order for the beam to be at equilibrium (not moving). This means that the area under the shear curve above the x axis and below the x axis will always be equal when you are drawing a shear diagram.
-

I made this video. . . it may help. Then this one for moment diagrams.
--Michael Ermann, Amber Book creator
-
MengFu,
Here is a post explaining the real reason why w/o any math. in short, shear +/- is the direction the beam would fall if it were sheared off at that point. https://are5community.ncarb.org/hc/en-us/community/posts/12649806252311-Explanation-of-Shear-w-o-any-Math
It is an almost meaningless amount of information added into the diagram IMO. I cannot think of one useful thing you could do by knowing shear was negative instead of positive.


Please sign in to leave a comment.
Comments
12 comments